In a Monopoly Market Structure, there is only one firm prevailing in a particular industry. However, from a regulatory view, monopoly power exists when a single firm controls 25% or more of a particular market. For example, De Beers is known to have a monopoly in the diamond industry.
A Natural Monopoly Market Structure is the result of natural advantages like a strategic location or an abundance of mineral resources. For example, many gulf countries have a monopoly in crude oil exploration because of abundant naturally occurring oil resources.
Characteristics of a Monopoly Market Structure
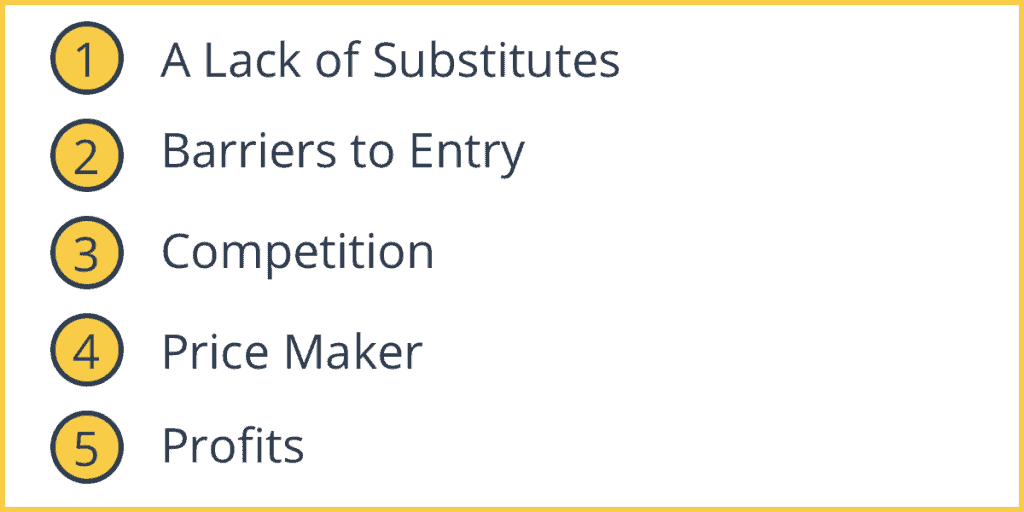
The following are key features that are typically found in a monopoly market structure:
1. A Lack of Substitutes
One firm producing a good without close substitutes. The product is often unique. Ex: When Apple started producing the iPad, it arguably had a monopoly over the tablet market.
2. Barriers to Entry
There are significant barriers to entry set up by the monopolist. If new firms enter the industry, the monopolist will not have complete control of a firm on the supply. These barriers imply that under a monopoly there is no difference between a firm and an industry.
3. Competition
There are no close competitors in the market for that product.
4. Price Maker
The monopolist decides the price of the product since it has the market power. This makes the monopolist a price maker.
5. Profits
While a monopolist can maintain supernormal profits in the long run, it doesn’t necessarily make profits. A monopolist can be a loss-making or revenue-maximizing too. This is not possible under perfect competition. If abnormal profits are available in the long run, other firms will enter the competition with the result abnormal profits will be eliminated.
Advantages of a Monopoly
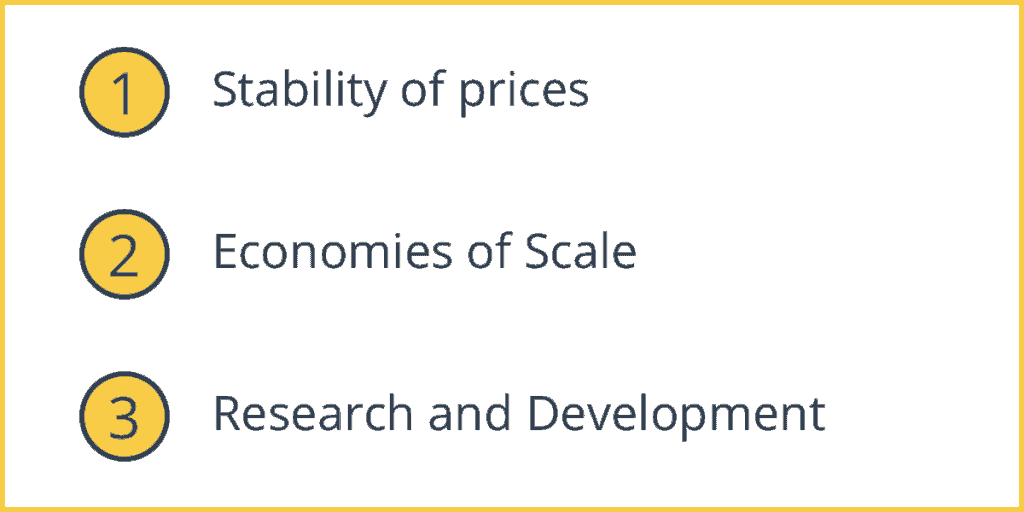
1. Stability of prices
In a monopoly market structure, the prices are pretty stable. This is because there is only one firm involved in the market that sets the prices since there is no competing product. In other types of market structures prices are not stable and tend to be elastic as a result of the competition.
2. Economies of Scale
Since there is a single seller in the market, it leads to economies of scale because of large-scale production which lowers the cost per unit for the seller. The seller may pass this benefit down to the consumer in terms of a lower price.
3. Research and Development
Since the monopolist is making abnormal or supernormal profits, the firm can invest that money into research and development. Customers may get better quality products at reduced prices leading to enhanced consumer surplus and satisfaction.
Disadvantages of a Monopoly
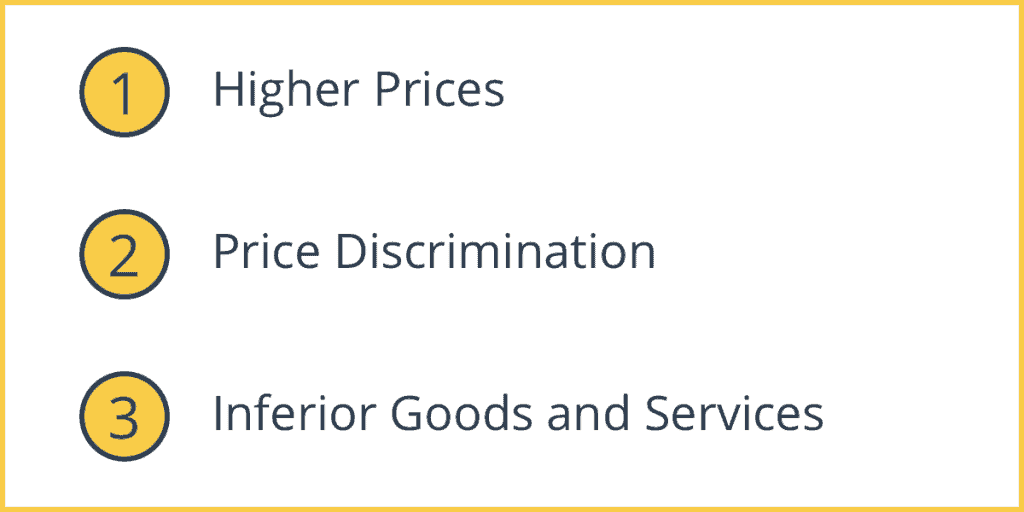
1. Higher Prices
The monopolist could set a very high price for the product leading to the exploitation of consumers as they have no option but to buy it from the seller due to the lack of competition in the market.
2. Price Discrimination
Monopolists can sometimes use price discrimination, where they charge different prices on the same product for different consumers. This depends on market conditions.
3. Inferior Goods and Services
The lack of competition may cause the monopoly firm to produce inferior goods and services because they know the goods will sell.
Revenue Curves for a Monopoly
Total Revenue
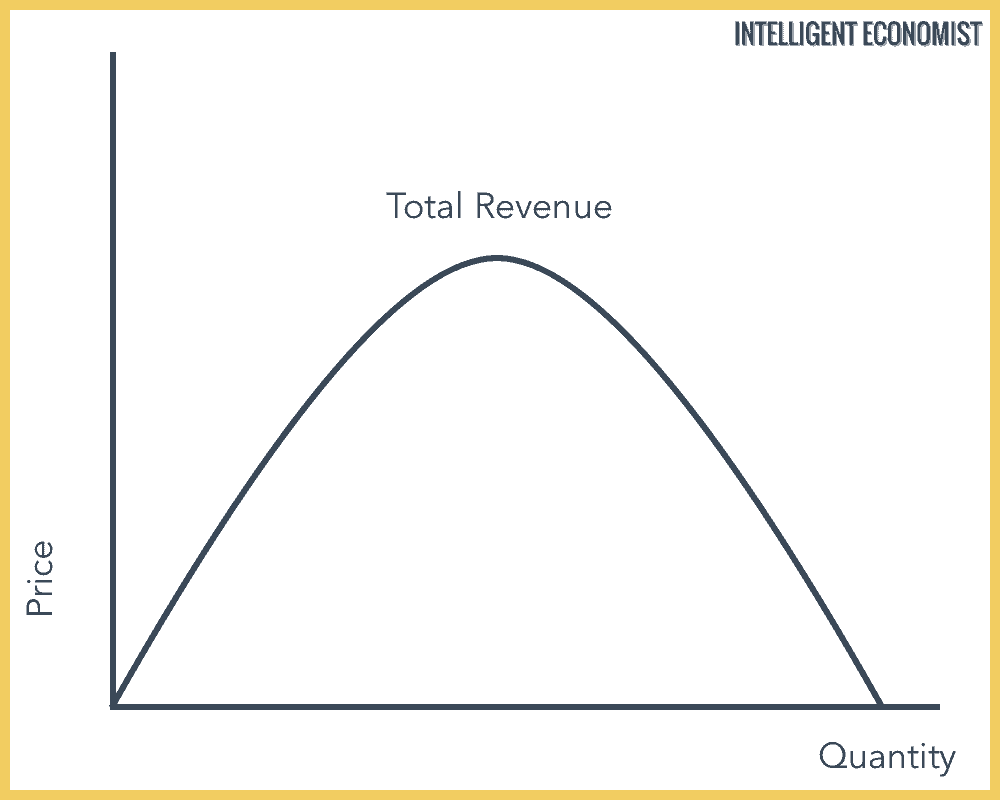
Total Revenue – Total Quantity x Price.
Average & Marginal Revenue
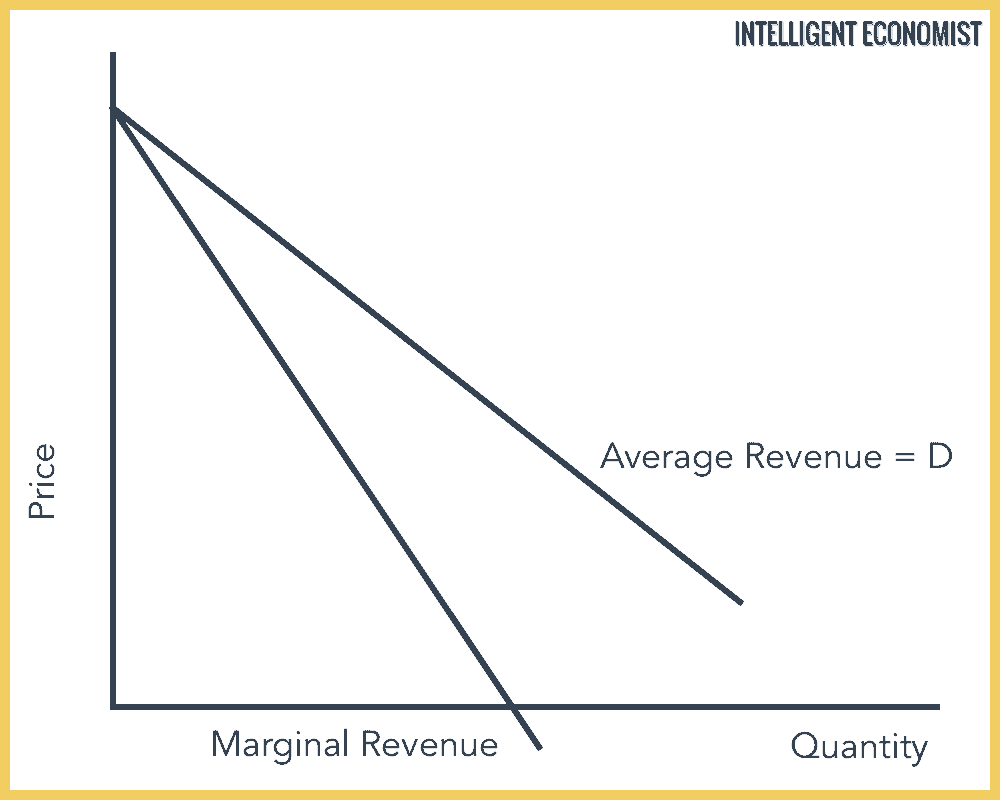
1. Marginal Revenue
Marginal revenue is the revenue earned by selling one more unit.
2. Average Revenue
Average Revenue is Total Revenue/Quantity.
Note:
- A monopolist can choose the level of output or the price, not both since it has a negatively sloped demand curve.
- The Marginal Revenue curve has double the slope of the Average Revenue curve.
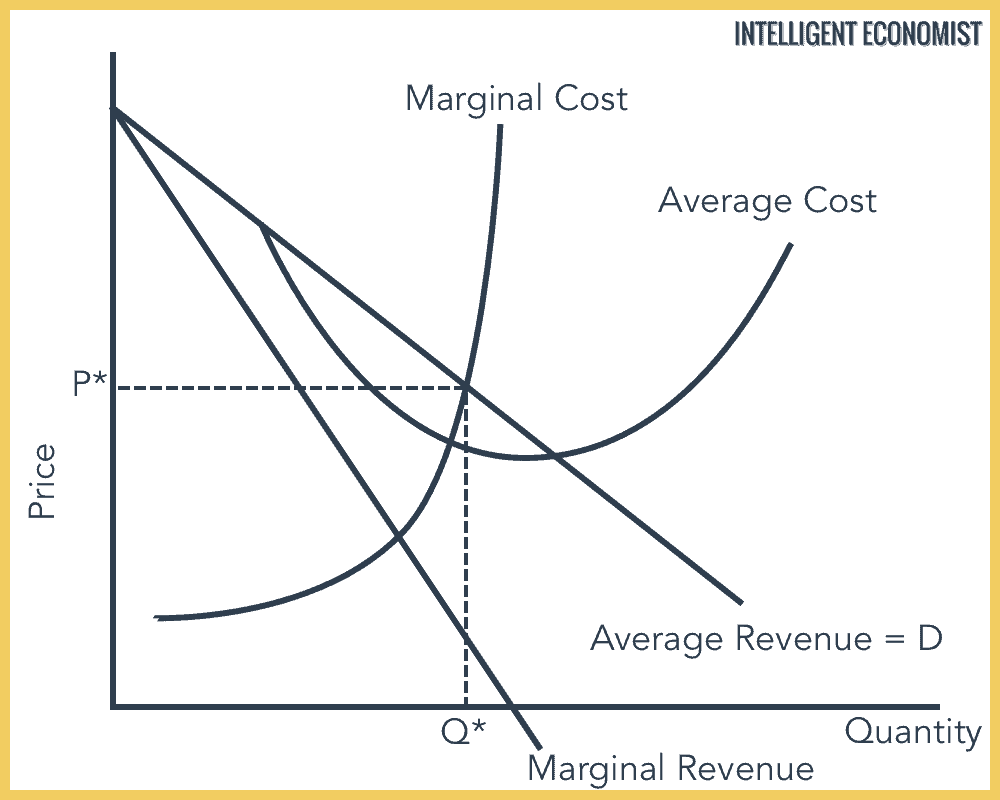
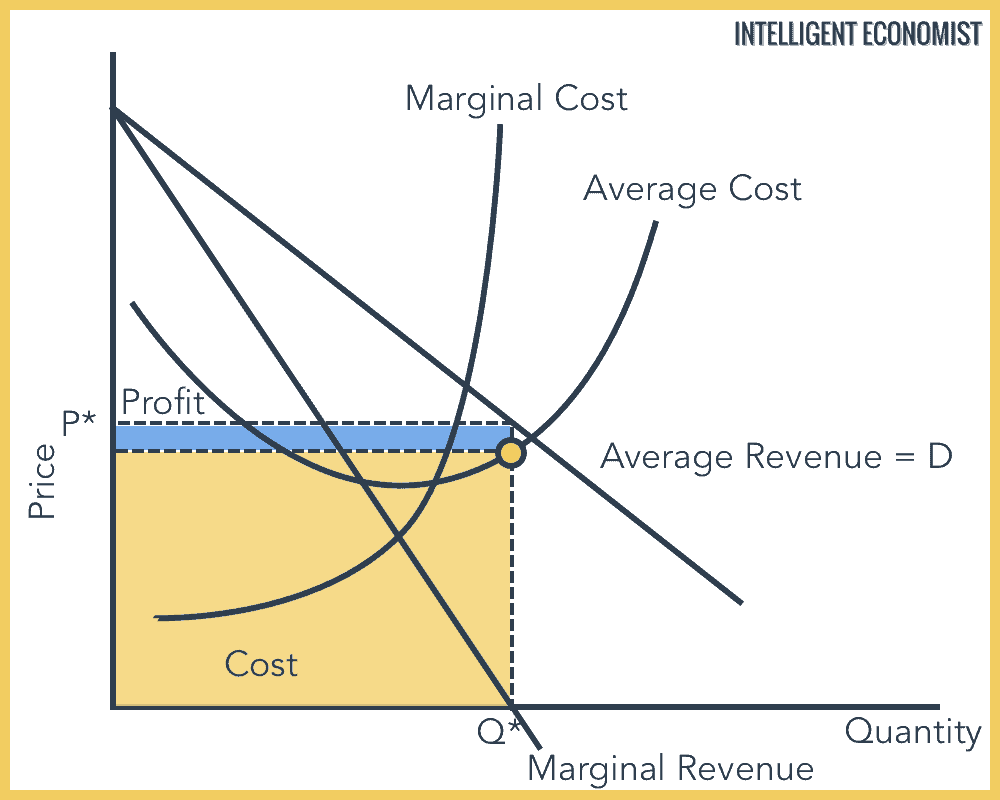
A Profit Maximizing Monopolist
The Monopoly is a supernormal profit maker and using the profit maximization rule MC = MR; we can find the Quantity and the Price. After finding out where MC meets MR, draw a vertical line to the Demand curve, and the corresponding value on the vertical axis is the price.
If the monopoly charges a higher price, then less quantity will be bought, and that equilibrium won’t be maximum profit. This equilibrium will continue in the long run, if barriers continue to exist, demand remains consistent, and the cost is maintained. We calculate the cost by drawing a vertical line from where Quantity meets the Average Cost curve to the price line.
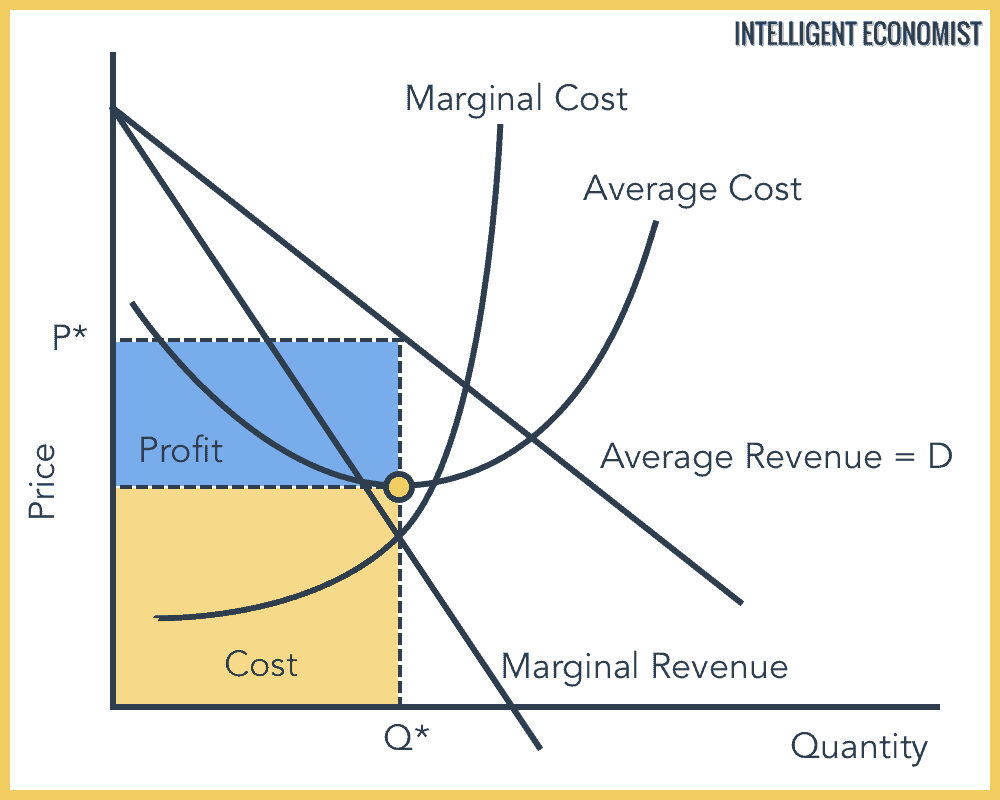
Profit Maximizing Output is set at Marginal Cost (MC) = Marginal Revenue (MR)
Revenue Maximizing Output is set at Marginal Revenue (MR) = 0
A Revenue Maximizing Monopolist
When the firm wants to maximize revenue, it produces more units but charges a lower price. To find the quantity and price, draw a vertical line to the demand curve from where Marginal Revenue = 0. The price is found by drawing a horizontal line from the demand curve to the price axis (vertical). The cost is found by drawing a vertical line from where Quantity meets the Average Cost curve to the price line. The blue box represents supernormal profits and the yellow box, cost.
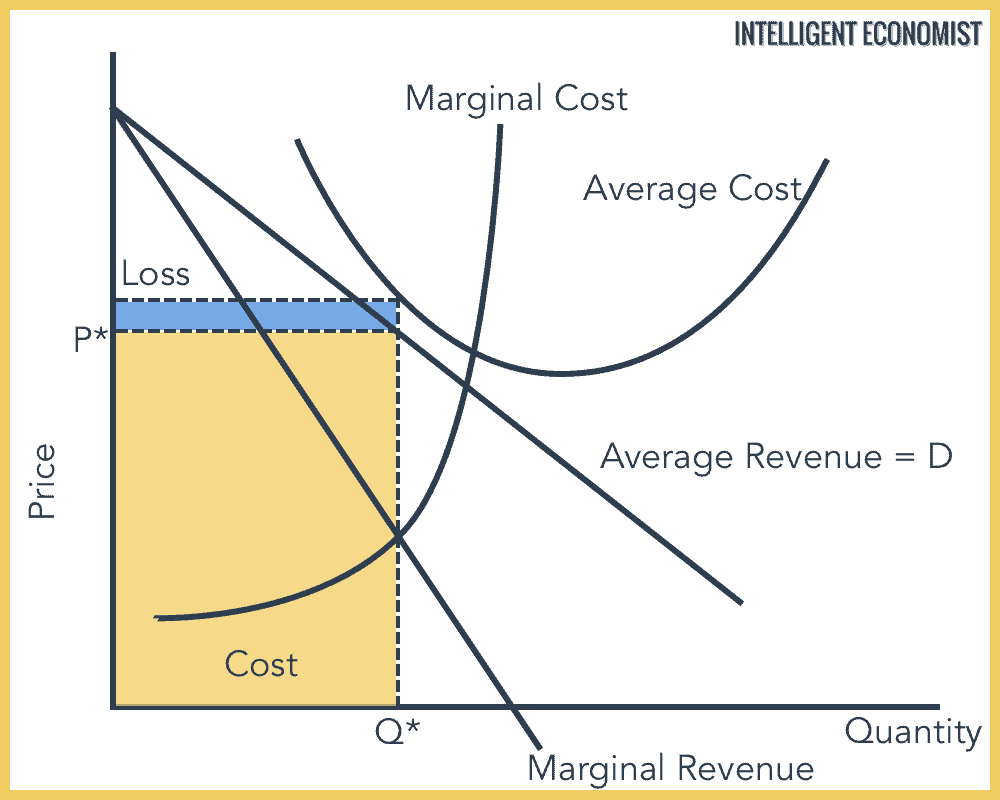
A Loss Making Monopolist
A monopolist can be a loss-making one if the Average Cost lies above Average Revenue. In this case, the firm’s costs are greater than its revenue so it makes a loss. The yellow and blue combined add up to cost. The yellow box represents revenue and the blue box, loss. The cost is found by drawing a vertical line from where Quantity meets the Average Cost curve to the price line.
What is an Efficient Output for Society?
At output Q* and price P*, the Monopolistic firm is producing at a lower price but a higher output than a profit or revenue-maximizing firm. This is the efficiency of monopolies.
Thus, there is a misallocation of resources because of monopoly power. Since monopolies aren’t forced to produce at minimum average cost, so there is productive inefficiency.