The Environmental Kuznets Curve is used to graph the idea that as an economy develops, market forces begin to increase and economic inequality decreases. More specifically that as the economy grows, initially the environment suffers but eventually the relationship between the environment and the society improves.
The Kuznets hypothesis was first proposed by Simon Kuznets in the 1950s and ’60s.
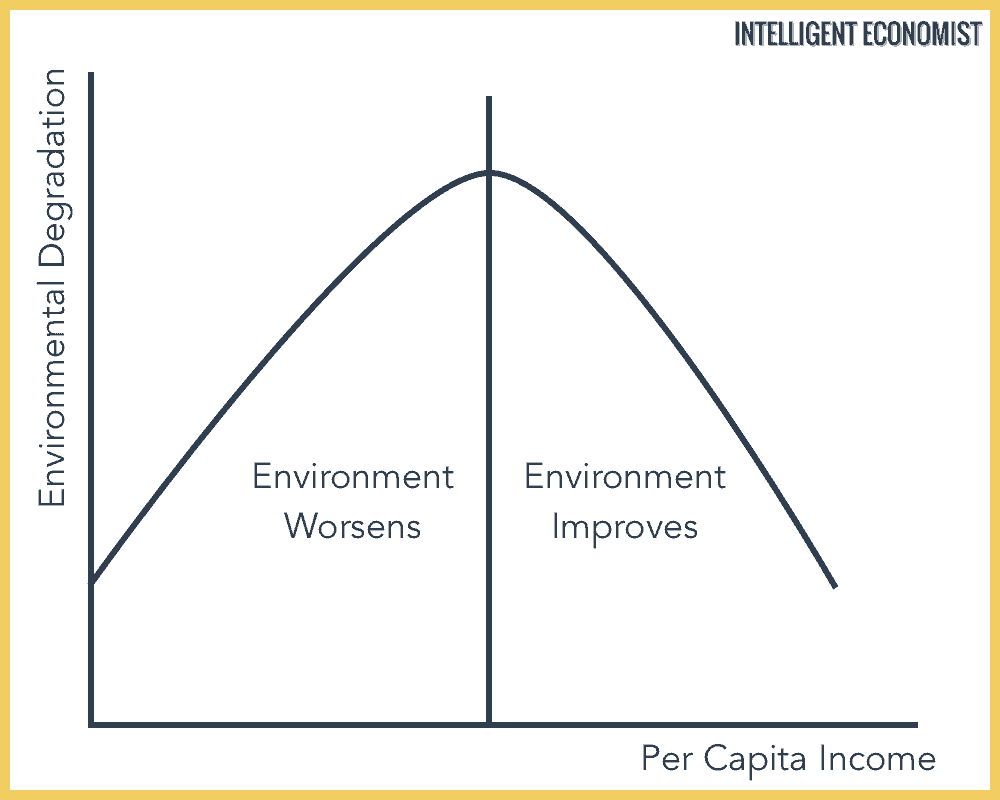
The Curve is represented by an inverted U curve. The graph’s Y-axis is labeled as inequality, while time or per-capita income is depicted by the X-axis.
In other words, the theory suggests that as a nation is going through industrialization, and mechanization of agriculture – the nation’s economy will naturally move towards cities. Inequality is expected to decrease when rural populations move towards urban cities.
The Environmental Kuznets Curve
The Environmental Kuznets Curve adheres to the same idea of the hypothesized relationship between equality and development. The difference is that it looks at environment equality.
Before the Environmental Kuznets Curve hypothesis, it was generally assumed that rich economies destroyed the environment at a faster pace than poorer countries. However, with the Environmental Kuznets Curve, the relationship between the environment’s health and the economy has been reanalyzed.
The idea is that as economic development growth occurs, the environment will worsen until a certain point where the country reaches a specific average income. Then money is invested back into the environment, and the ecosystem is restored.
Critics argue that economic growth doesn’t always lead to a better environment and sometimes the opposite may actually be true.
What are the Implications of the Environmental Kuznets Curve?
1. When an economy is primarily pre-industrial and agrarian, the environment is usually clean and untouched by pollutants from industrial economic activities.
2. As the economy shifts towards development and industrialization, the environment is at a higher risk of being harmed by pollution and depletion of natural resources.
3. The curve then returns to a cleaner environment when economic growth continues, and people choose to spend their incomes on improving the environment by cleaning water and improving air quality. People become more aware of the benefits to the environment.
There are apparently many limitations to the Environmental Kuznets Curve hypothesis. However, there have been several studies to show that specific environmental issues do follow the Kuznets Curve. These include air and water pollutants such as quantities of sulfur dioxide, suspended particulate matter, and fecal coliform.
Of course, it is difficult to make general statements as the Kuznets Curve relationship is dependent on the specific pollutant, the place, and what time frame. For example, economies often require regulation and government intervention to ensure that the environment is being protected, even as income levels rise.
As Economists conduct more studies, we will be able to reach a better understanding of what changes we can make to benefit both the environment and the economy.
hi – you mentioned studies showing that certain issues follow the kuznets curve. do you have any of them? it’s for an ecology paper I’m writing for uni and I need primary scientific sources, so if you had the ones you used for this to hand that would be super convenient. thank you