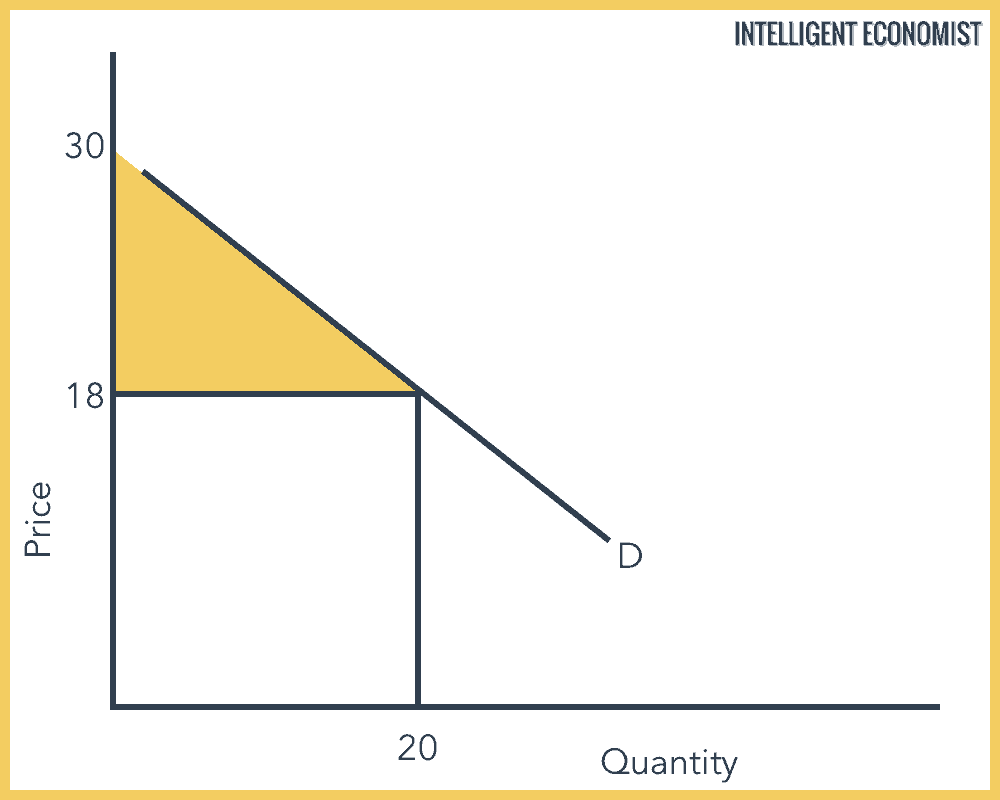
Consumer Surplus is the area under the demand curve (see the graph below) that represents the difference between what a consumer is willing and able to pay for a product, and what the consumer actually ends up paying.
Consumer surplus is positive when the price the consumer is willing to pay is more than the market price.

How to Calculate Consumer Surplus
In this graph, the consumer surplus is equal to 1/2 base x height.
The market price is $18 with quantity demanded at 20 units (what the consumer actually ends up paying), while $30 is the maximum price someone is willing to pay for a single unit. The base is $20.
1/2 x (20) x [(30 – 18)] = $120
Consumer Surplus Formula

In a graph like the one shown above, the formula for calculating consumer surplus is 1/2 the length of the base multiplied by the overall height.
In addition, the more general formula for calculating surplus formula outside the context of the graph is as follows:
Consumer surplus = maximum price willing to pay – actual price
In other words, this formula for consumer surplus represents the difference between the highest amount the consumer would pay (“maximum price willing to pay”) and the actual amount that the consumer pays (“actual price”).
Consumer Surplus Example
Let’s apply the above formula to an example situation. Let’s say there is a consumer who is in search of a car that fits a particular set of specifications: mileage of fewer than 50,000 miles and heated leather seats. The maximum price that this consumer would be willing to pay for a car that meets these criteria is $8,000. But lucky for them, they find a car that has only been driven 30,000 miles and has comfortable heated leather seats, and it’s being sold for only $6,000! Let’s plug that into the above formula:
Consumer surplus = $8,000 – $6,000
That means, in this case, the consumer surplus is a total of $2,000. This leftover money that the consumer was willing to pay for their car can now be applied to other purchases.
Consumer Surplus and Consumption
Why does consumer surplus decrease when there is increased consumption? The law of diminishing marginal utility states that the first of a given good purchased and consumed offers higher utility to the consumer than the second of that good consumed; the second good offers higher utility than the third of that good consumed, and the cycle continues.
For instance, if you’re quite hungry, you’ll derive a high degree of utility from purchasing a sandwich, so you’ll be willing to pay a fair amount for the sandwich. However, you will be less hungry for the second sandwich, so you will be willing to pay less for that sandwich. This means that the consumer surplus for a given good will decline as more and more of that good is consumed.
Producer and Consumer Surplus
Economists assume that consumers are always trying to maximize their utility, i.e. the satisfaction they gain from consuming a product. They choose a certain quantity of goods that would maximize their utility with their limited income.
Consumer surplus and producer surplus represent different areas on demand and supply curve respectively. Added together, the consumer and the producer surplus are equal to the overall economic surplus–that is, the overall benefit created by the economic interactions between producers and consumers in the free market. And if producers were capable of price discriminating perfectly (this means assessing exactly how much consumers would be willing to pay at best), the producer surplus would be the entire economic surplus.


Thank you for this wonderful demonstration. A clear and concise description that really helps!
This free one page explanation is more clear than ~5 pages of repetitive filler in a university textbook I paid $150 for. Thank you Prateek!