
Demand is defined as the amount of good or service a consumer is willing and able to buy per period of time. It is essential to understand the term “willing and able.” Many people want to buy products that they cannot afford at prices they cannot pay. However, because they are not able to purchase the product, we cannot include them in the demand.
The Demand can be plotted on a graph or even shown in a table. It shows how much of the product is desired at a certain price.
The Demand Curve
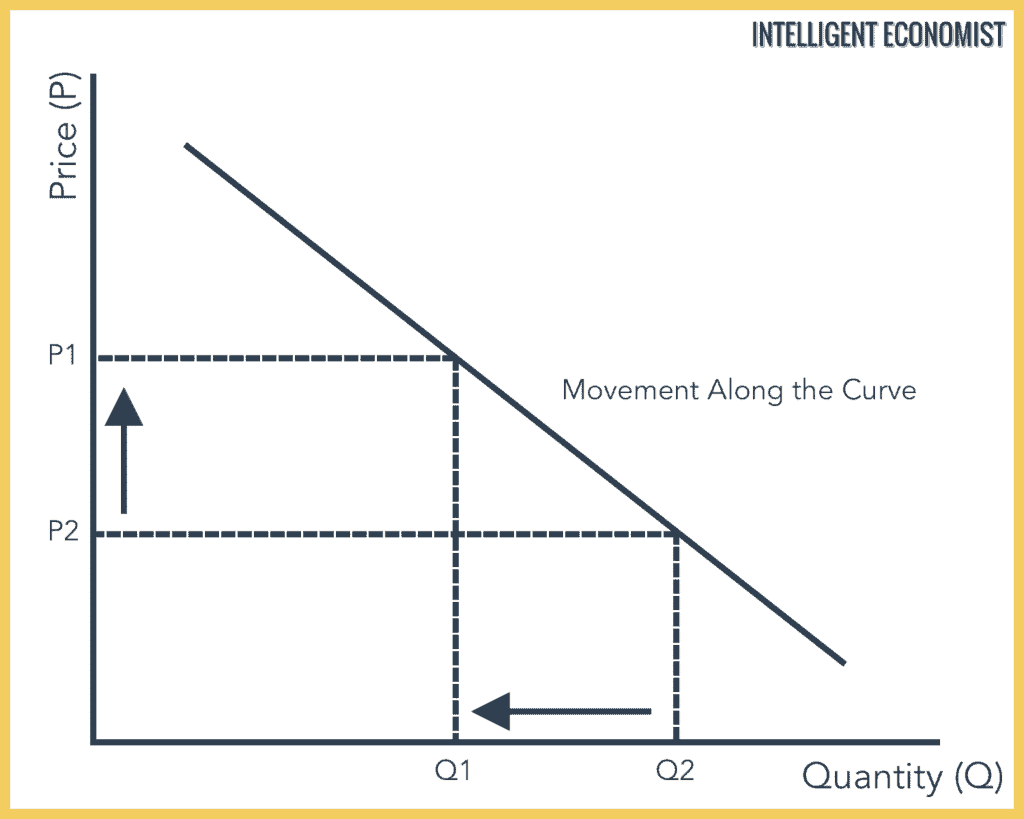
The graph above shows a movement along the curve, which illustrates how price (P)affects the quantity demanded (QD). At Price P2 the QD is Q2. When the price increases to P1, then the QD falls to Q1.
The Demand Function
The demand function shows the relation between the quantity demanded of a commodity by the consumers and the price of the product. It is generally represented by a straight line. To graph it, you need at least sets of data points to show how many goods were purchased at what price.
The demand function represents a more general relation between the price and demand for the good, but also the relationship between the other determinants of demand and the demand for the good.
The Law of Demand
The Law of Demand states that the quantity demanded for a good or service rises as the price falls, ceteris paribus (or with all other things being equal). The other-things-being-equal assumption is very important in law because the demand for goods also varies with several other factors than just the price.
Therefore, the Law of Demand is an inverse relationship between price and quantity demanded. However, there are a few exceptions to this law such as Giffen goods and Veblen goods.
Generally, the Law holds true because of two factors:
1. The Substitution Effect
The Substitution Effect occurs when there is a change in the price of a product. For example, we say that the price of olive oil has gone up. In comparison to olive oil, other cooking oils such as canola oil or peanut oil suddenly seem less expensive. Therefore, people will switch to a close substitute if the price goes up and the demand will increase.
To put it another way, if the price of a substitute of good X goes up, then good will become relatively cheaper and people will move towards good X. There will be an increase in demand for good X.
To take a real-world example, consider Coke and Pepsi. They are universally recognized to be good substitutes for each other. The Substitution Effect states that when the price of Coke goes up, then more people will more likely purchase Pepsi.
2. The Income Effect
The Income Effect also occurs when there is a change in the price of a product. For example, let’s say you buy four loaves of bread a month and then one day the price of a loaf of bread goes up. This increase in price will likely mean that you cannot afford to buy four loaves. Instead, you buy two. You’ve lowered your demand for bread because the price increase has reduced your disposable income. You won’t necessarily stop buying bread or switch over to something cheaper; you buy less.
Stated differently, if the price of good X rises, then the consumer’s purchasing power will drop and then people will tend to buy less of good X will the same income. The Income Effect simply means that when a good becomes more expensive then people can afford less of it.
A Shift in the Demand Curve
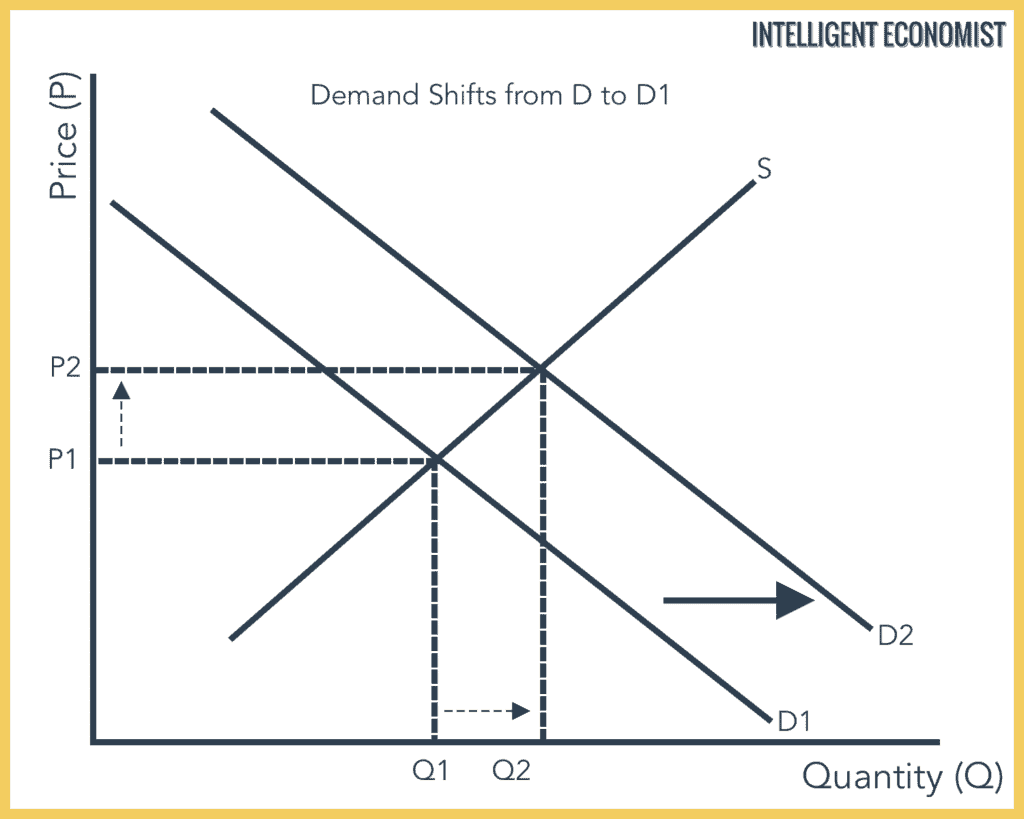
The rise in D is shown by the shift in the demand curve (from D to D₁). This results in Price and QD increasing from P1 to P2 and Q1 to Q2 respectively.
The above graph holds true for normal goods only. Normal goods are products that consumers buy more of if their disposable income (income after taxes) increases. Inferior goods are those products which are consumed less when someone’s disposable income increases. Cheap cars or highly discounted brands are examples of inferior goods.