
The Laffer Curve was conceptualized for modern economies by Arthur Laffer during a meeting in which he argued against President Gerald Ford’s tax increase.
The Laffer Curve shows the relationship between tax revenue collected by the government and tax rates paid by citizens. The tax rates depicted on a Laffer Curve range from 0% to 100%.
The Laffer Curve Explained
The shape of the curve implies that as tax rates rise, tax revenues will also increase. However, these increased tax revenues will only increase until a peak, and after which, the tax revenues begin to decline. This means that after a point it is counter-intuitive to keep increasing tax rates.
The idea behind the Laffer Curve is that people will stop or be discouraged from working after a certain point because the tax rates will be too high.
History of the Laffer Curve
During the mid-1970s, the United States was in the midst of a deep recession, and Arthur Laffer, the former chief economist at the Office of Management and Budget, at dinner with White House advisors Dick Cheney and Don Rumsfeld, suggested that the federal government’s 70 percent marginal tax rates were responsible for the slow growth.
To illustrate his point, Arthur grabbed a pen and a cloth cocktail napkin and drew a chart showing that when tax rates get too high, they penalize work and investment and can lead to revenue losses for the government. This rough diagram later became known as the Laffer Curve.
The Laffer Curve has been criticized for being too simple and making too many assumptions.
Implications of the Laffer Curve
At 0%, the government collects 0 tax revenue. The tax revenue increases to a point C, and after that point, the tax revenue falls even with an increase in tax rates.
The decrease in tax revenue arises because higher tax rates create disincentives for people to work harder and to invest. At a 100% tax rate, people will have no incentive to work at all.
If tax rates decrease, then leisure time becomes more expensive so people might work more. But at the same time disposable income increases, so people are more willing to have ‘fun,’ so the effect is uncertain. Economists do not agree on where point C lies.
Many politicians use the concept behind the Laffer Curve to justify tax cuts – that lower tax rates mean businesses and consumers will spend more and boost the economy. Companies will invest and hire more workers and consumers will use the extra disposable income to make purchases. And thus, the loss of tax revenue is replaced by the increase in consumer and business activity. The idea is that these tax cuts would increase tax revenue because the tax rates lie beyond the point C in the diagram below.
The Laffer Curve Graph
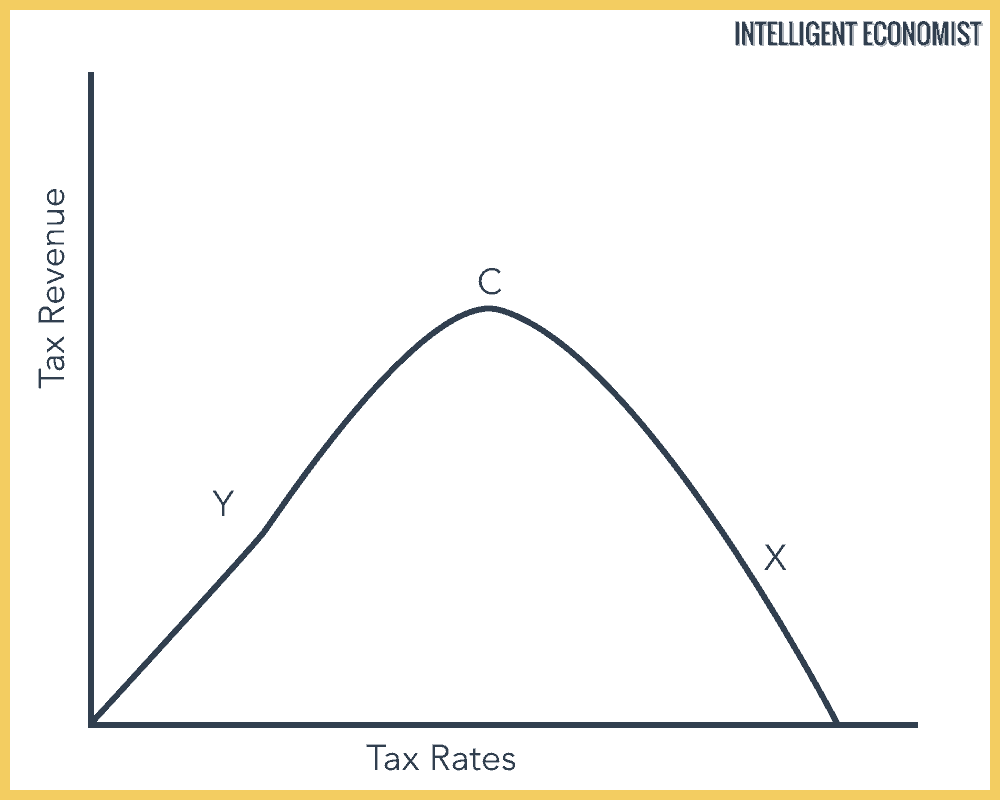
What happens when tax rates increase from C to X?
The Laffer Curve encourages tax evasion and creates disincentives for people to cheat. It also results in a lower Gross National Product and lower Aggregate Demand. However, the results depends on local laws, culture and work patterns.