A Yield Curve is a graph of the yields (interest rates) of bonds with different maturities. Short terms bonds generally have a lower yield because they are most liquid.
Three Basic Facts about Yield Curves
- Interest rates on bonds of different maturities tend to move together over time. This means that yield curves from different dates do not generally intersect.
- When short-term rates are meager, yield curves tend to have steep upward slopes. When short-term rates are very high, yield curves tend to have flat or downward slopes
- Yield curves are almost always upward sloping.
Explanation of the Three Basic Facts
1. The Expectations Hypothesis
in year bond, today = i1 year bond, today + ie1 year bond, t + 1year +…+ ie1, t (n=1) / n
Weakness – upward slope implies that interest goes up every year, not always true.
Strengths – explains why yield curves are steeply upward sloped when short-term bonds are very low and explain why interest move together.
Ex: i1, t = 5%, ie1, t+1 = 6%, ie1, t+2 = 7%,
Interest on a one year bond = 5%
Interest on a two-year bond = (5+6)/2 = 5.5%
Interest on a three-year bond = (5+6+7)/3 = 6%
2. Liquidity Premium Hypothesis
The Liquidity Preference Theory says that the demand for money is not to borrow money but the desire to remain liquid. The interest rate is the ‘price’ for money. The liquidity premium hypothesis says that a more liquid asset is less risky, so it has to pay less risk premium.
Yield Curves
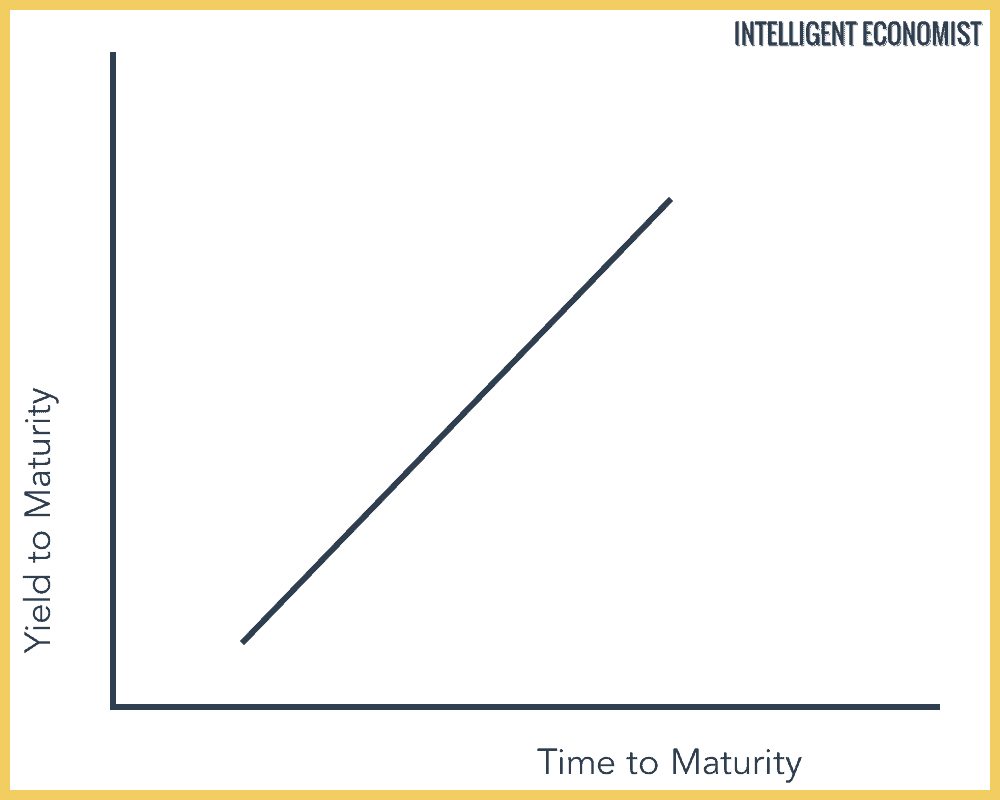
A Yield Curve expecting interest rates to rise over time
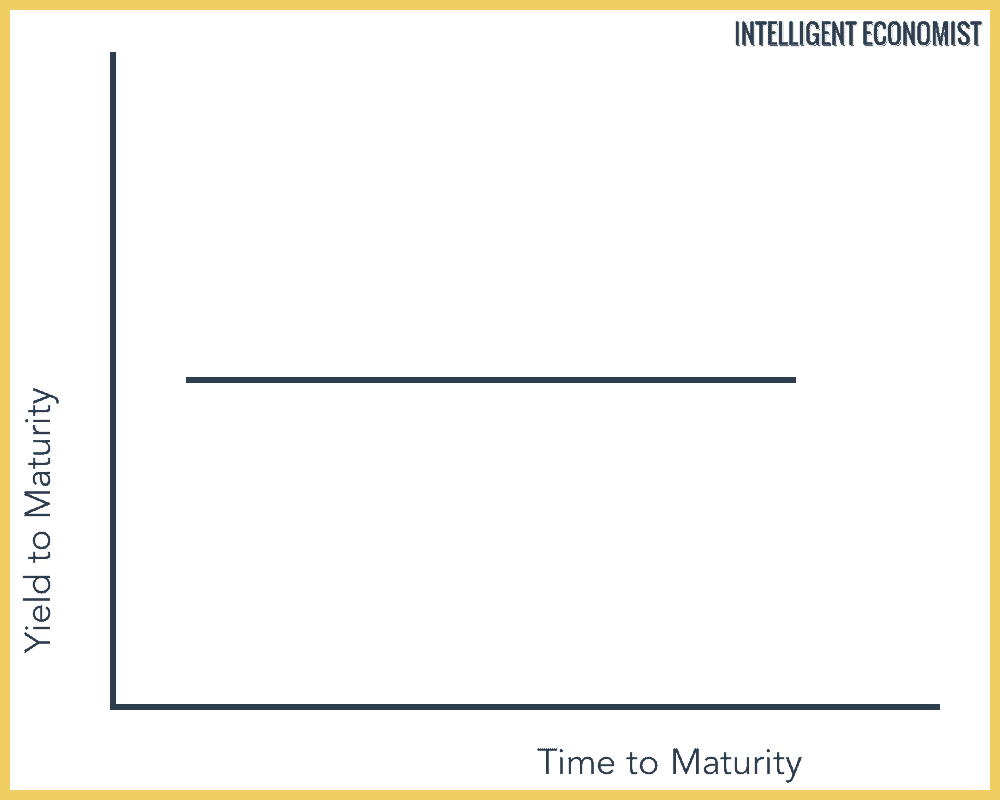
Interest rates are expected to remain unchanged
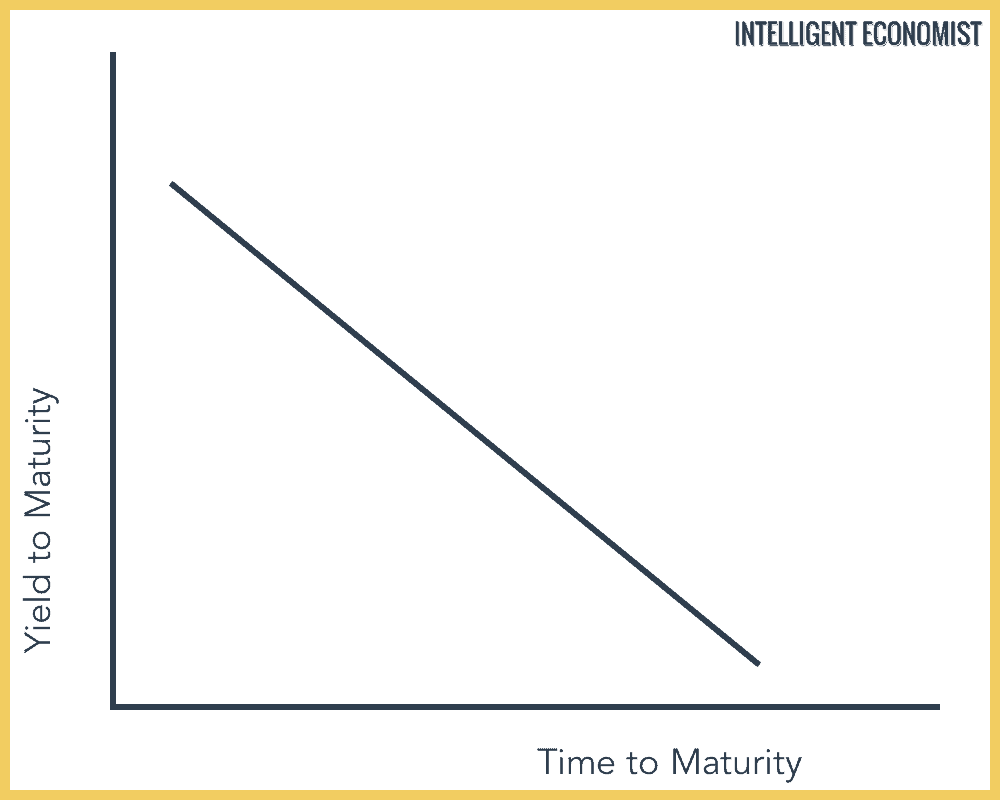
Interest rates are expected to drop. Signal of an oncoming recession: