The best way to show a country’s available resources, along with the maximum two goods produced from those resources, is by calculating the production possibilities frontier (PPF). Be aware that the “production possibilities curve” (PPC) is another way of referring to the production possibilities frontier, referring to the curve shown on a graph of the frontier—see below for an example of such a graph.
The production possibilities frontier shows the productive capabilities of a country. A production possibility curve even shows the basic economic problem of a country having limited resources, facing opportunity costs and scarcity in the economy. Selecting one alternative over another one is known as opportunity cost. Economists use PPF to illustrate the trade-offs that arise from scarcity.
The production possibilities frontier is a concept in the fields of both business analysis and macroeconomics. Within business analysis, the production possibility curve represents the various production levels of two goods requiring one resource that is available in a limited amount.
Meanwhile, within the field of macroeconomics, it’s production possibilities frontier shows the situation in which a company is producing goods/services most efficiently to use resources the best possible way, in light of limited production capabilities. This allows the country’s limited resources to be allocated most efficiently and completely.
Production Possibility Frontier Assumptions
One of the first and most important things to note is that economists often base their models off of key assumptions; such as “ceteris paribus,” meaning all else remains the same or all other variables are kept constant. Economists do this in order to isolate a particular relationship, so that other variables do not obscure what they’re attempting to discover.
In order to simplify the calculations, the production possibility frontier makes some assumptions that are not true in practice. These assumptions include the following: that the country only produces two goods, that it has a fixed amount of resources, and that it has a static level of technological development. Additionally, the PPF operates on the assumption that there are no inefficiencies interfering with output—that production is as efficient as it could possibly be; it also assumes that one commodity’s production must decrease to allow the increased production of another commodity.
Production Possibilities Frontier Example
The production possibilities frontier is graphed as a curve, or arc. On such a graph, one of the commodities is shown on the x-axis, while the other is shown on the y-axis. The entirety of the curve is made up of points at which the two commodities are being produced in different amounts, most efficiently using the limited resources that they require.
The following graph shows the production possibilities frontier for a particular country’s economy. It notes what the country can do, as opposed to what it actually does. In this example, the two commodities that that country produces are food (F) and clothes (C). (This is, of course, a highly simplified view of an economy, just for the purposes of understanding the production possibilities frontier.)
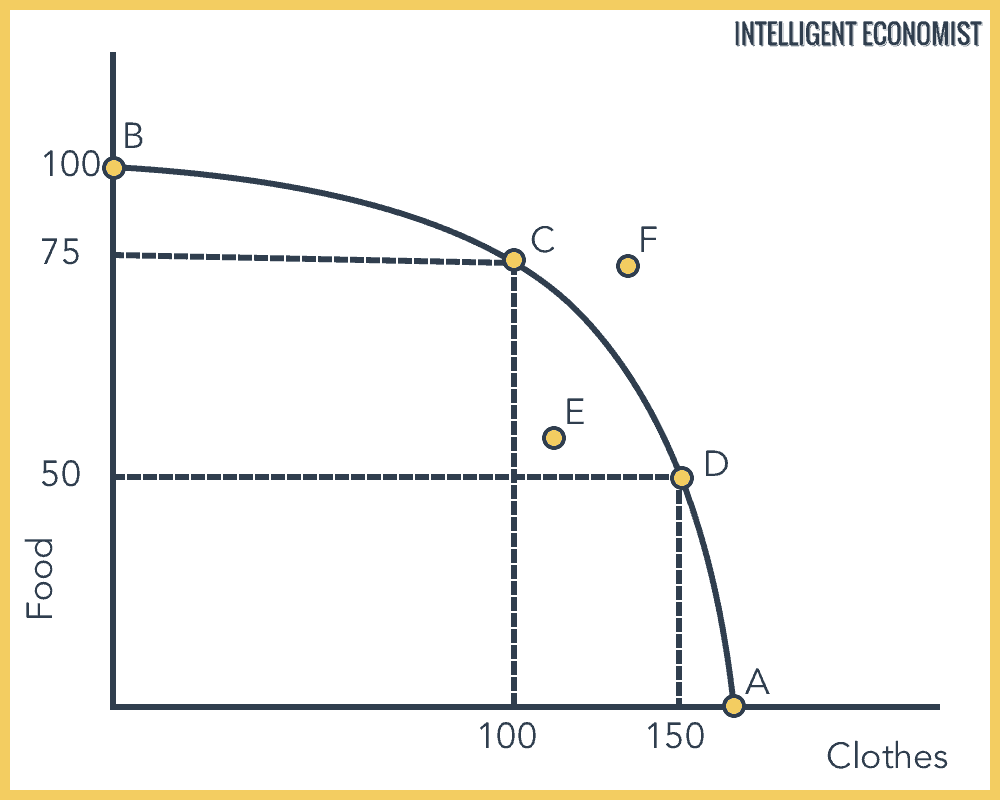
- A shows the production level of clothes alone
- B indicates the production level of food only
- C is one possible combination of levels of production of both food and clothes (75F, 100C)
- D is another combination of these production levels (50F, 150C)
- E shows inefficient utilization of resources or unemployed resources, i.e. a case in which the output is less than what it has the potential to be
- F shows an unattainable level of production, based on current resources
If the country wants to produce more food, they must produce fewer clothes, based on limited resource availability. Likewise, if they want to produce more clothes, they must produce less food. The government must assess the opportunity cost of producing more of one or the other. The graph above demonstrates this trade-off. If this country wants to increase the production of food from 50 to 75 units, this requires sacrificing the production of 50 units of clothes. And if this country wants to increase the production of clothes from 100 to 150 units, they must sacrifice the production of 25 units of food.
An outward shift of the production possibilities frontier is only possible if the country discovers new resources or there is an improvement in technological development. Furthermore, an inward shift is also possible. This can happen if there is a natural or human-made disaster, like a hurricane destroying a factory and machinery.
Production Possibilities Frontier Graph
Sometimes, the production possibility frontier does not look like a curve—instead, it’s linear, meaning that it’s simply a straight line. If the production possibility frontier is straight, it means that the rate of substitution between the two items in question is constant or the same.
Consequently, the resources saved by producing one less unit of food are just sufficient to allow the economy to produce the same added amount of clothes. This is constant regardless of how much of each item the country is currently producing. This consistent trade-off is known as “production under constant costs.”
Thank you for the comment and yes I’ll keep posting
if there is anything specific then please do let me know
Your articles are concise to comprehend.. I’m thankful to you.