
The marginal cost of production is an economic concept that describes the increase in total production cost when producing one more unit of a good. It is highly useful to decision-making in that it allows firms to understand what level of production will allow them to have economies of scale. Economies of scale involve the most optimally efficient and productive levels of production for a given firm and its products.
With increased production, marginal cost will generally fall early on, and then rise because marginal factor inputs’ returns will begin to diminish, making the marginal factors more costly—this is due to the law of diminishing marginal returns.
By calculating the marginal cost (we’ll describe how to do that below), you can make a decision about whether to increase production. Assuming the marginal cost of production of one more unit is lower than the price of that good per unit, then producing more of that good will be profitable.
How to Calculate Marginal Cost
Here’s how to find marginal cost: divide the total change in production costs with additional production by the change in the overall quantity (that is, how many more things you are producing).
Marginal Cost Formula

The marginal cost formula described above is summed up as follows:
Marginal Cost = (Change in Cost) / (Change in Quantity)
What do we mean by “change in cost” and “change in quantity”?
Costs of production (which include fixed costs as well as variable costs) increase with more production because producing more units means buying more raw materials and/or hiring more workers. The change in cost is equal to production cost from levels of output prior to the increase in production subtracted from the cost from levels of output following the increase in production.
Meanwhile, change in quantity is simply the increase in levels of production by a number of units. That is, subtract the quantity from before the increase in production from the quantity from after the increase in production—that will give you the change in quantity.
Marginal Cost Example
Let’s say there’s a small company called ABC Wallets that produces 5,000 high-quality, artisanal leather wallets every year. Every year, this level of production costs them $250,000—these are their production costs.
At some point, though, the word gets out about how great their wallets are, and more people want to buy them, so there is a very high demand for them. ABC Wallets’ owners decide to produce more wallets every year, increasing their total annual production to 10,000 wallets.
Although they do have to hire more workers, and also purchase better and more efficient tools and machinery (the cost of which is not accounted for in this example, for the sake of simplicity, although in the real world it, of course, should be), they find that their production costs per unit decrease. At this point, they’re producing twice as many wallets for just $375,000 that year.
To find the marginal cost of each additional wallet produced, let’s plug this example into the formula above:
Marginal Cost = $125,000 / 5,000
This means that the marginal cost of each additional unit produced is $25.
Marginal Cost Curve
As the graph below demonstrates, in order to maximize its profits, a business will choose to raise production levels until the marginal cost (marked as MC) is equal to the marginal revenue (marked as MR).
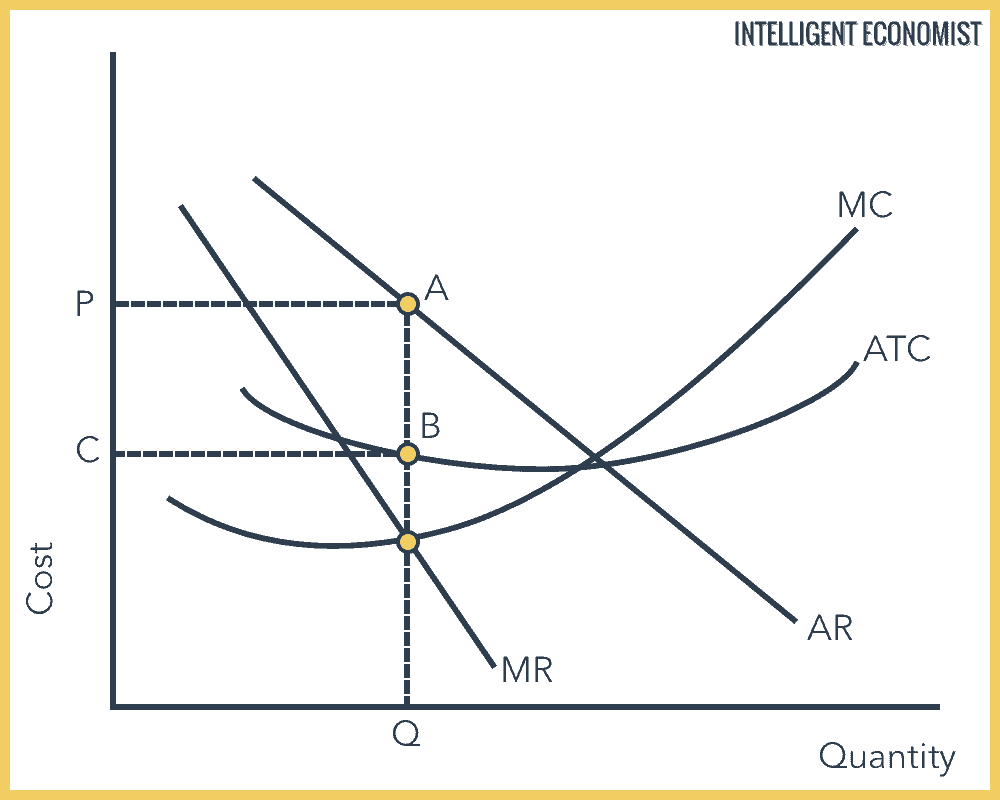
Additionally, a supply curve is that section of the MC curve that lies above average variable costs—that is, point B and up, otherwise called the “shut-down point.” Meanwhile, point A is known as the “break-even point.” Businesses don’t supply at levels below that point, because they will not be able to pay for their opportunity cost.