Otherwise known as an expansionary gap, an inflationary gap is the gap between an economy’s full-employment real GDP and its real GDP. In other words, the inflationary gap refers to the difference (that is, the gap) between the actual gross domestic product (GDP) and the GDP that would exist if the economy were at full employment (this is also known as the “potential GDP”).
In the case of an inflationary gap, the real GDP is higher than the potential GDP. (This is in contrast to a deflationary gap, when the real GDP is lower than the potential GDP.) The real GDP is greater than the potential GDP due to the fact that, when the real GDP increases, the general price level also increases in the long run.
First established by influential economist John Maynard Keynes, the macroeconomic concept of the inflationary gap is applied in order to assess and quantify the pressure of inflation. During the course of the business cycle, it arises when the economy is in the process of expanding. Specifically, they appear when the output of an economy that could potentially be created at full employment (that is, the full-employment real GDP) is less than the equilibrium level of that economy.
What Does an Inflationary Gap Mean?
In practice, an inflationary gap happens when demand for goods and services is greater than production as a result of situations like high employment, high government expenditure, and high levels of trade activity. Then, the real GDP ends up higher than the potential GDP—there is an inflationary gap. It’s called an inflationary gap because the higher real GDP leads to higher levels of consumption throughout the economy, increasing prices over time.
To describe this process more specifically: consumers experience higher levels of demand for goods and services because there are more funds available throughout the economy. Meanwhile, supply has not caught up with this higher demand, as production levels do not usually increase as quickly as consumer demand does. As a result, prices increase in order to return the market to equilibrium.
Inflationary Gap Graph
The graph below is a visual representation of an inflationary gap. In this image, the vertical axis shows aggregate expenditure, while the horizontal axis shows national income or aggregate output.
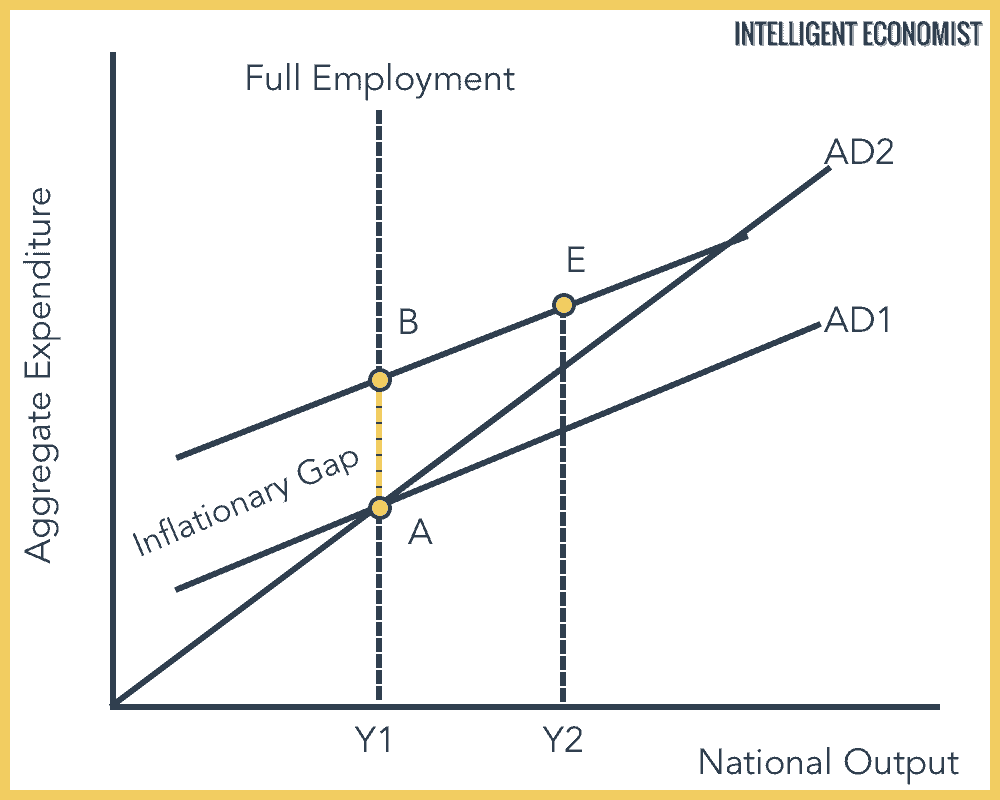
Furthermore, in the above graph, Y1 is the national income level at full employment. C + I + G + X – M is equal to the aggregate demand curve marked AD. This crosses the 45 degree line at point A, which means that an equilibrium income is at Y1.
The price will not rise, because aggregate demand and supply are equal. And then if the AD1 curve moves up to AD2, the equilibrium output does not increase–output can’t increase past the full employment level.
To put it another way, full employment means output is unable to go up to Y2. So when we’re at the level of Y1 full employment output, the inflationary gap is AB (as marked in the diagram). The distance, vertically, from the aggregate demand and the 45 degree line–at the full employment level of national income–is the inflationary gap.
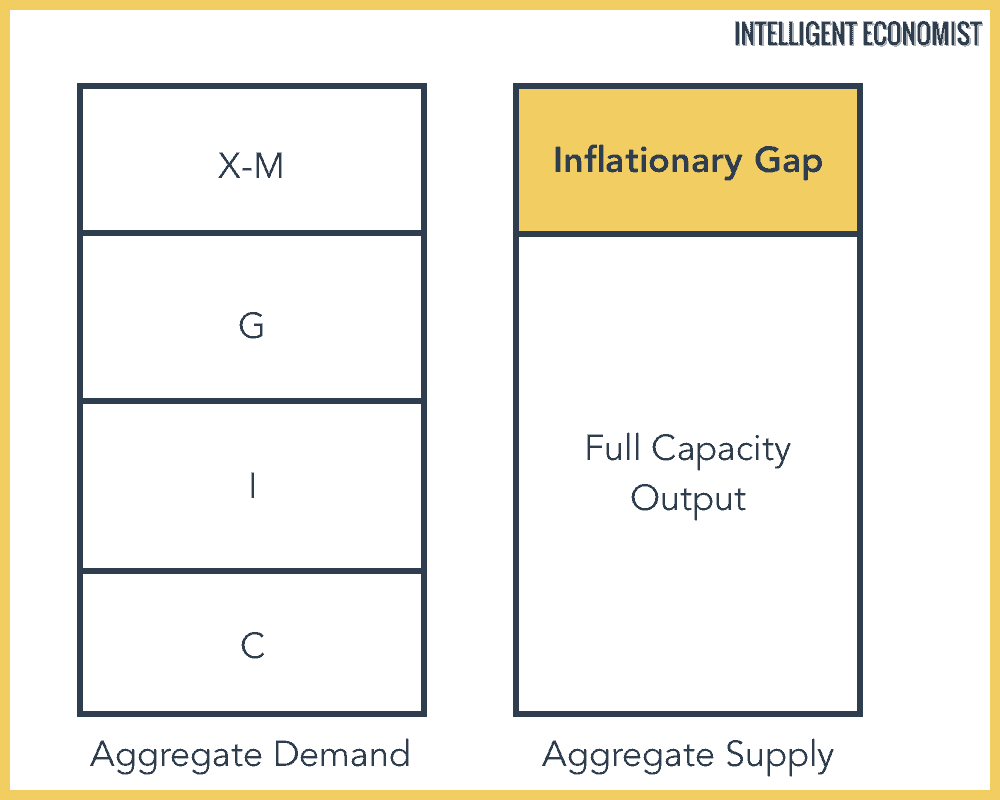
A more straightforward diagram of inflationary gap
Here’s another, more straightforward way to visualize the inflationary gap. When aggregate demand (C + I + G + X – M) is greater than aggregate supply, this means there is an inflationary gap, marked below:
Inflationary Gap Example
For instance, let’s say there is a national economy that is producing 10,000 gallons of milk per week. However, the aggregate weekly demand for milk is 15,000 gallons. This means there is an inflationary gap of 5,000 gallons of milk per week. The aggregate demand for milk is higher than the full-employment real GDP. On the other hand, if the aggregate demand for milk were only 8,000 gallons of milk per week, there would be no inflationary gap.
How Can Governments Reduce Inflationary Output Gaps?
Governments have an array of contractionary fiscal policies at their disposal that they can put into practice to help minimize inflationary gaps. The most significant of such policies include the following:
- Increasing taxes
- Reducing overall government spending
- Reducing transfer payments
- Increasing interest rates
- Issuing bonds and securities
These and other such fiscal policies work to bring the economy back to a state of equilibrium. They do so by influencing demand for goods and reducing the amount of money at consumers’ disposal.